
Our new study proves that only 14% of those who suffered restrictions as ‘infected’ individuals with a positive PCR coronavirus test were actually infected.
During the unfortunate coronavirus years, we all had to endure nasal or throat swabs followed by PCR tests, sometimes on a daily basis, combined with anxious waiting: Is it positive? Will I now be unable to travel, go to work, university, restaurants or meeting places? Even the German Infection Protection Act stipulates this testing procedure. In our new study [1], recently published in Frontiers in Epidemiology, we show that only 14% of those who tested positive with a PCR test and therefore often had to experience some form of restriction actually had a manifest infection.
This can be deduced from a comparison of data collected with a PCR test and an IgG antibody test. The polymerase chain reaction (PCR), invented by Kary Mullis [2] in the 1980s, for which he received the Nobel Prize, uses tiny snippets of any gene sequence and searches for the matching counterpart in a sample. And if it finds even a single such counterpart, it amplifies it as often as desired and as long as the process is kept running. This works through cycles of repetitions. According to laboratory wisdom, I have been told by specialists, this is normally not done more than 20 times, because otherwise the risk of a false positive result becomes too great. One would then claim that a certain gene sequence was found in someone or in a sample, even though it is not actually there. This so-called cycle threshold, abbreviated CT, is therefore an essential part of a PCR test. This is because it provides information about how often the original sample must be amplified in order to find something. Can anyone remember a CT value being specified on the PCR test that was given to us? No? That’s right. Because it was almost never specified. However, we know from various studies that German laboratories worked thoroughly with CT values of 30 to 35, sometimes even up to 40 (evidence in our publication). Therefore, the risk of false positive results was very high.
And that is exactly what we prove with our study. My colleagues Michael Günther, a biophysicist, and Robert Rockenfeller, a mathematician, downloaded and saved the data from the website of the ‘Accredited Laboratories in Medicine’ (ALM), and I helped a little with the interpretation. Interestingly, to my knowledge, this ALM data can no longer be found. But anyone who wants to check the figures can find them in the supplementary material for this publication. At the time my colleagues began the study, this data was publicly available. This network of laboratories processed around 90% of all PCR and IgG tests in Germany.
PCR tests therefore provide information on whether someone has come into contact with a specific gene fragment. Kary Mullis warned against using his test carelessly back then. He once said that, all in all, you can find anything if you search long enough. I recommend reading the autobiography [2] of this biochemistry genius. A little anecdote: colleagues tried to publish this autobiography in German. However, his widow did not release the rights. She had apparently received a visit shortly before from some agencies who advised her to let the matter rest. Ultimately, Mullis conveniently died in September 2019 and was therefore unable to comment on the misuse of his test in the coronavirus pandemic.
The gene fragments found by the test may originate from an infection. This is likely if a significant increase is already seen at a low cycle number of the chain reaction, i.e., if there is a relatively large amount of starting material. They may originate from a past infection. However, they may also originate from the slippers of the laboratory technician who took the swabs, or from the air in which the swabs were taken, or from a whole range of other indirect and irrelevant sources. They do not indicate an infection, but rather contact with genetic material.
When someone has an infection, and especially when this infection becomes systemic, i.e., affects the entire organism, the immune system sounds the alarm. It cannot be emphasised enough that respiratory infections are primarily fought off by the mucous membranes. In addition to the non-specific immune system, this is mainly the responsibility of IgA antibodies, which are primarily found on the cells of the mucous membrane. They normally ensure that the infection does not penetrate deeper into the body. That’s why we might have a slight cold and produce mucus. If the infection becomes more serious, IgG antibodies can be found in the blood. They indicate that our immune system has reacted to a specific infectious agent, an antigen, and produced antibodies. They are therefore clear evidence of an infection because they are specific to a particular antigen.
We are ignoring the fact that such antibodies, especially when they originate from a natural immune response, often also trigger cross-immunity, i.e. they offer effective protection against a larger group of similar antigens. Incidentally, this is one of the reasons why many people who have come into contact with SARS-CoV-2 have not fallen ill. This is because in our part of the world, virtually everyone has had contact with all kinds of coronaviruses since kindergarten age, and the existing antibody protection seems to have become generalized. Studies have shown that even in the early stages of the coronavirus pandemic, at least 45% of blood samples tested from the pre-coronavirus period produced immune responses to SARS-CoV-2, precisely because this cross-immunity was present [3, 4].
IgG tests therefore provide relatively specific information about who has actually been infected with the SARS-CoV-2 virus. The basis for this study was a simple consideration:
If the same laboratories evaluate both PCR tests and IgG tests, then the numbers of subjects reported as positive should somehow be closely related to each other, taking into account various technical details: e.g. that it takes at least 7–10 days for antibody-mediated immunity to develop; that perhaps more PCR tests are performed than IgG tests; that some people may be tested more often, etc.
My colleagues therefore calculated the percentage of all positive PCR tests per week and the percentage of all positive IgG tests per week (shifted by the necessary latency period) from the available data. If these two curves are mathematically correlated, the result is a function from which the percentage of those who had positive test results in both tests at the same time can be read. This was 14%. The confidence interval is narrow (13.5% — 14.5%). The estimate is therefore very good.
I reproduce here the important part B of the original graph showing these relationships (Figure; part A shows the original data from ALM and is included in the publication).
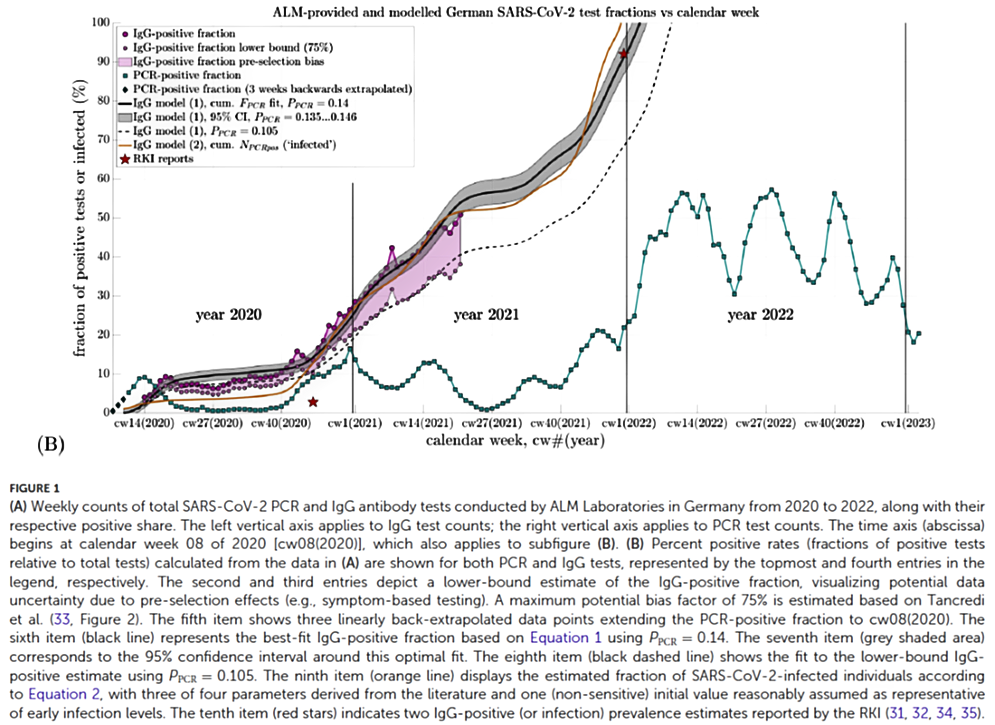
This Figure B shows the proportion of PCR-positive cases (green squares) per week, the proportion of IgG-positive cases (large purple circles) and the 75% lower range of IgG-positive cases (small purple circles). The black curve is the mathematical model derived from the correlation between the IgG data and the PCR data, which uses the parameter of 14% (Ppcr = 0.14). The yellow curve comes from a second validation model and shows that the two curves are relatively similar. The shaded grey area indicates the 95% confidence interval of the parameter estimate of 14%. The weeks are plotted on the x-axis at the bottom (labelled as ‘calendar week (CW)’ with the number and the corresponding year). The y-axis shows the percentage of positives per week. The stars are data from RKI reports. The black dotted line is the extrapolation of a model in which only 10% of PCR positives are also IgG positive, i.e. a poorer estimate.
To see whether the adjusted curves accurately reflected reality, they were also extrapolated beyond the available data and compared with values published by the RKI on the number of positive IgG tests at various later points in time. These values were predicted almost perfectly by the mathematical curve fitting. In addition, my colleagues used another published model for validation.
Several important conclusions can be drawn from this study; these were recently clarified by my colleagues in an interview with Multipolar Magazine. The most important one is certainly that PCR tests are unsuitable for detecting infections. Many people have said this repeatedly. Now we know for certain: only 14% or one in seven people who test positive with PCR also show a positive IgG response and have therefore been infected. The consequence should be that the requirement for PCR tests is discontinued, that this instrument is removed from the German Infection Protection Act as a criterion for determining infectivity, and that all legal decisions based on this criterion are subsequently revised.
Another important conclusion is that by the end of 2020, nearly 30% of the population had come into contact with the virus without any catastrophe occurring. Analysis of mortality data published elsewhere by my colleagues shows that there was no excess mortality in 2020 and that the supposed ‘killer virus’ is not evident in the data. But the ‘killer vaccine’ certainly is: excess mortality did not occur until 2021 [5]. Furthermore, the data show that at the end of 2020, even before the vaccination campaign began, the increase in infections was 1.8% per week. So if the natural infection had been allowed to continue, nearly 94% of the population would have been immune by the end of 2021 (52 * 1.8). After the vaccination campaign began, the increase was 1.1%, and by the end of 2021, 85% of the population was immune according to the model. This is relatively close to the 92% reported by the RKI.
This leads to two further interesting conclusions:
- Based on the data available in 2020, it could have been assumed that within another year, the entire population would be immune to the virus without any major drama, which did not occur by the end of 2020 (not because of lockdowns and other measures, but despite them). The aggressive promotion of vaccination and political coercion were completely unnecessary.
- By the end of 2021, the population was practically completely immune. The RKI knew this and published it. At that point at the latest, all measures – coercion of the population through lockdowns, closures, mask mandates and vaccination pressure – could and should have been stopped on the basis of evidence and data. The fact that this did not happen shows that civil protection was a pretext for a political agenda. In my view, those responsible should be held accountable for this.
Sources and Literature
- Günther M, Rockenfeller R, Walach H. A calibration of nucleic acid (PCR) by antibody (IgG) tests in Germany: the course of SARS-CoV-2 infections estimated. Frontiers in Epidemiology. 2025;Volume 5 – 2025. doi: https://doi.org/10.3389/fepid.2025.1592629.
- Mullis K. Dancing Naked in the Mind Field. Lodon: Bloomsbury; 1998.
- Mateus J, Grifoni A, Tarke A, Sidney J, Ramirez SI, Dan JM, et al. Selective and cross-reactive SARS-CoV-2 T cell epitopes in unexposed humans. Science. 2020;370(6512):89-94. doi: https://doi.org/10.1126/science.abd3871.
- Ng KW, Faulkner N, Cornish GH, Rosa A, Harvey R, Hussain S, et al. Preexisting and de novo humoral immunity to SARS-CoV-2 in humans. Science. 2020:eabe1107. doi: https://doi.org/10.1126/science.abe1107.
- Rockenfeller R, Günther M, Mörl F. Reports of deaths are an exaggeration: All-cause and NAA-test-conditional mortality in Germany during the SARS-CoV-2 era. Royal Society Open Science. 2023;10:221551. doi: https://doi.org/10.1098/rsos.221551.